The Manchester Derby: City's $355M Free Cash Flow against United’s $800M Debt ⚽
$355M in FCF by City, $750M in total debt by United, & more!
Over the years, the intense on-field rivalry between Manchester City and Manchester United has captivated fans worldwide. Off the field, both clubs have strategically bolstered their financial positions, with stable management driving Man City to triple its free cash flow over the past 5 years.
Here’s a peek into their financial dynamics:
⚽ City boasted $355M in FCF in 2023
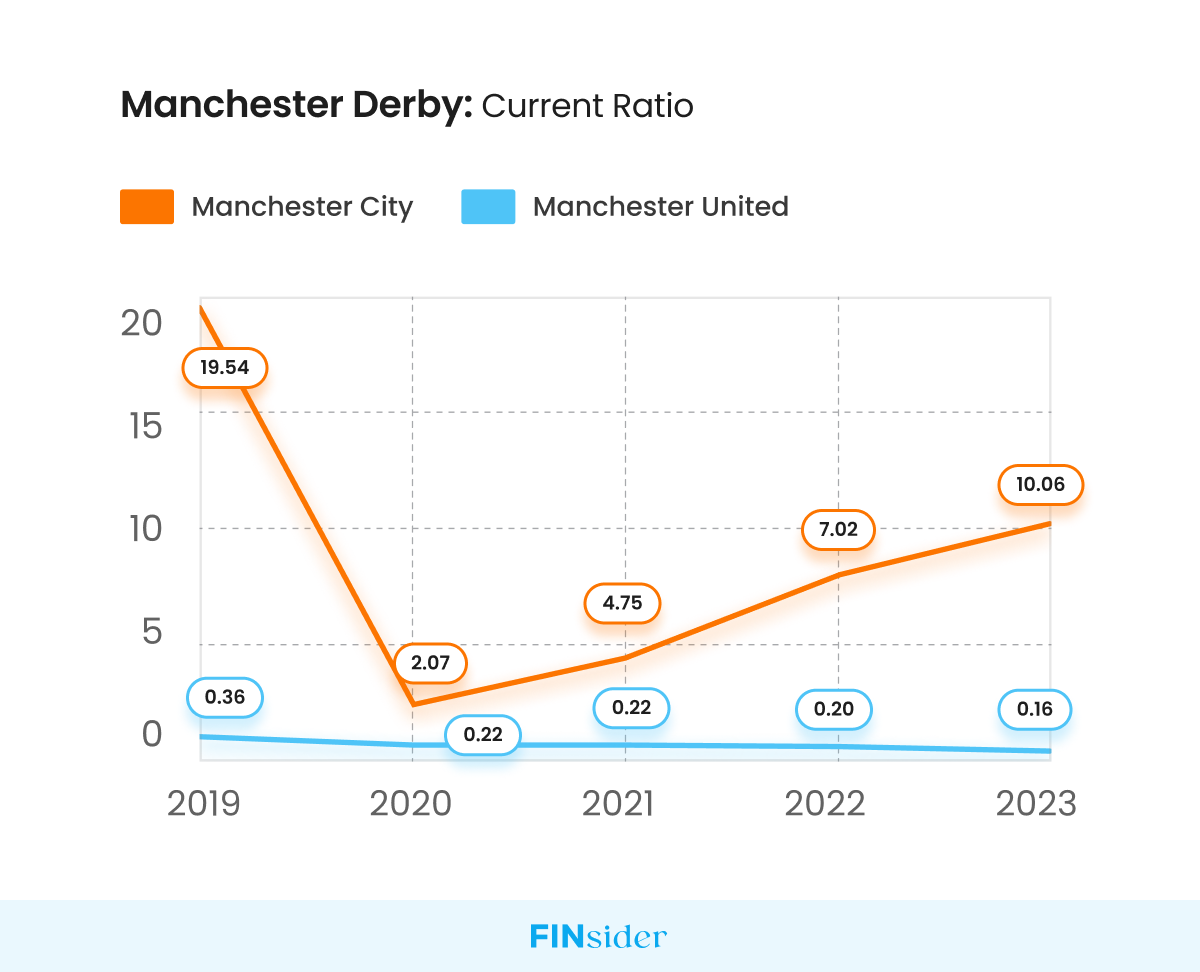
⚽ City leverages $9 in assets for every dollar borrowed
⚽ United shouldered a hefty $750M in total debt in 2023
⚽ United carries $12 in debt for every dollar of equity
But what steps is Man United taking to close the gap and challenge Man City's dominance?
Let's dive in and find out! 🔍
English Football is a $7B Industry! 💰
Europe's 'Big Five' leagues (England, Germany, Italy, France, Spain) dominate with a 58% market share. In 2024, the Premier League reported a $7.36B profit, driven by commercials, matchdays, & broadcasting.
The biggest expenditures are player transfers, stadiums, & development. Summer 2023 saw Premier League clubs shell out $3.5B on transfers, led by Chelsea ($855M), Man United ($755M), & Arsenal ($700M).
Now, let’s shift our focus to the major financial yardstick to analyze any organization’s treasury performance—the Free Cash Flow (FCF).
In 2023, Manchester City's FCF was 3x That of Manchester United's 📈
Man City’s 5-year average FCF is $347M, while Man United’s is $125M. From 2019-23, United’s FCF had a negative CAGR of -24.65%, compared to City’s -8%.
COVID-19 lockdowns globally halted stadium gatherings, impacting matchday revenue. In 2020, Man United's FCF fell to -$31.62M, showing insufficient cash flow to cover expenses, as seen in the chart:
But, why is Man United falling behind?
Man City’s on-field outperformance: Man City won the Premier League 4 times in the last 5 years, while Man United struggled to stay in the Top 3, reflecting in their FCF.
Management stability with Pep Guardiola: Under Pep, Man City won 16 major trophies with a 73.6% win rate, while Man United, under 5 managers and the Glazers, accrued $1B in debt without securing a title.
Commercial deals: Man City's commercial income surged 50% since 2019, now 48% of total revenue. In the 2022/23 season, it hit $437M surpassing Man United ($388M), Real Madrid ($355M), & Liverpool ($307M), leading all clubs.
Man City outperformed Man United in FCF, but let's also look into their debt trends!
Also read: How Apple Leads with 1.3x Average FCF of Big Tech.
Manchester United's Debt is 3x that of Manchester City's 📊
Man United's debt rose from ($644M) in 2019 to ($791M) in 2023, with a 5-year CAGR of 5.29%.
Meanwhile, Man City's debt began at ($123.36M) in 2019, peaked at ($257.18M) in 2020, and then decreased to ($235M) by 2023, reflecting an 18% CAGR:
💡 Reasons for Manchester United’s High Debt
Signing “Star” players: In the last 5 years, Man United spent $974M on star players like Harry Maguire & Casemiro. By 2023, their transfer payment debt stood at $407M.
The Glazer family’s acquisition: From 1931 to 2005, United was debt-free. In 2020-21, they paid $27M in interest.
The Covid Shock: In 2020, English football, including United, saw sales revenue drop 21% with FCF turning negative at -$31M, prompting increased borrowing.
Next, let’s analyze the management of long-term and short-term liabilities by both clubs.
Also read: How is Mastercard's Debt Strategy a Threat to Visa's Cash Supremacy?
For Every Dollar of Liability, Manchester City Holds $9 in Assets 💵
From 2019-23, Man United's Current Ratio averaged 0.23, indicating potential challenges in meeting short-term obligations. In contrast, Man City averaged a Current Ratio of 8.69, highlighting a strong short-term financial position:
Why is Manchester City’s Current Ratio exceptionally good?
Asset Management: From 2019-23, United's assets declined by -15.98% CAGR, while City's grew by 29.78%.
Liability Management: In 2023, United reported $1.5B in total liabilities, while City reported only $70M, indicating a stronger financial position for City.
Also read: How Netflix said “NO” to debt-driven growth.
For Every Dollar of Equity, Manchester United Carries a Debt of $12
Man United's debt ratio surged from 2.61 in 2019 to 11.65 in 2023, showing a significant increase in debt reliance. In contrast, Man City’s debt ratio was much lower, staying between 0.01-0.18 during the same period:
So, why are the two clubs’ debt-to-equity ratios different?
Man United’s high Debt-to-Equity ratio can be due to:
Aggressive investments in player transfers and infrastructure
The COVID-19 impact reduced revenue, increasing reliance on debt
Man City’s low Debt-to-Equity ratio can be attributed to:
Wealthy ownership investments, reducing the need for high debt.
Successful revenue strategies, like sponsorships and commercial income.
Also read: $30B HubSpot Faces Liquidity Issues: Will Google Acquire?
Man City Won! Is It Too Late for Man Utd? ⚽
Manchester City maintains a strong financial position with high Free Cash Flow and low debt, while Manchester United faces challenges with high debt and lower liquidity.
Despite these obstacles, United's rich history and resilience suggest they can rebound with effective management and financial strategies!


